The World on Scientific Canvas - Three Plots to Make You Think
This is the first post in a new series where I highlight plots that I came across in scientific literature that will be interesting for a broad audience. Today I look at why poor stay poor (economic inequality), why you should move to Italy but not Singapore (labor productivity), and why buying processed foods costs you more than you think (microbiome diversity).
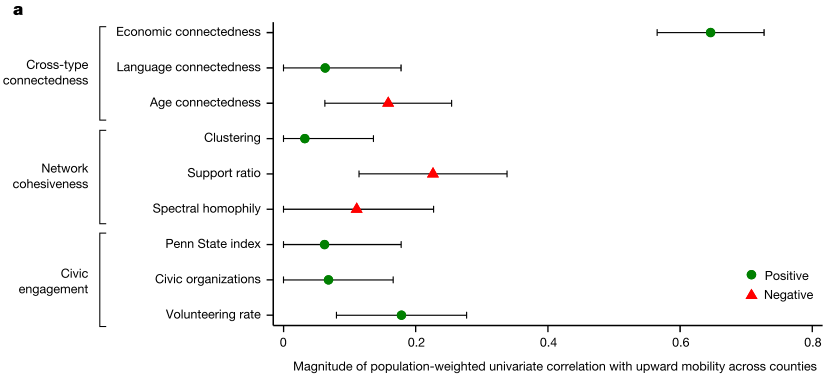
Plot 1. Economic connectedness is by far the most impactful way to increase economic mobility (in the US)

This plot comes from the paper Social capital I: measurement and associations with economic mobility which, already from the title, is absolutely a stunning read. The researchers looked at what are drivers of upward economic mobility (in the US!) and concluded that one that matters by far the most is the relative share of high socioeconomic status (SES) friends, a quantity they termed economic connectedness. They find that if low-income children had the same type of friends as high-income children do, they would earn 20% more on average in adulthood! So what does this mean? You, dear reader, are probably relatively wealthy or have a good chance of being so in the future so if you care about economic inequality (and you should, because in the long run it hurst everybody!) go ahead and make friends with everyone, especially with people of relatively low SES! Equally stunningly, many places which you would have thought are great destinations to elevate one’s or one’s family SES (e.g., Bay Area) are performing very poorly on economic connectedness, and consequently you would be better off moving to plenty of other places, many of which are much cheaper to live in. If you did not think segregation or gentrification is a problem, now you know it is. You can find the map of economic connectedness in the US here: socialcapital.org.
Plot 2. The harder you work the poorer you get (geographically speaking)

You would probably think that considering a country’s GDP is relevant when trying to find out where to relocate to, but that number tells you very little about how hard attaining that level of income may be. It turns out that labor productivity, how many hours you have to work to earn a certain wage, is more informative. The plot I chose shows that if you live in Singapore, you will have about double the annual income of someone living in Italy, but you will pay for this by working over 600 hours per year more on average. That’s over 75 8-hour working days a year! You can make many more comparisons yourself if you head over to the interactive plot at ourworldindata.org. There is more insight that can be gleaned from the plot. One is, for example, that while we have done away with slavery as conventionally defined, its modern-day equivalent is rampant. The GDP of Bangladesh is 8% that of the Netherlands, while people in Bangladesh work nearly 1’000 hours per year more to earn it. That’s over 120 8-hour days a year! And that says nothing about the conditions this work is done in! This becomes even more obscene of one makes the comparison with Luxembourg, Switzerland, or Norway. If you consider the trend on the plot, you will quickly see that in countries with more productive workers, people tend to work less. That by extension leads to another insight: Don’t be afraid AI will take our jobs! Look forward to it instead! It is the most effective tool for increasing labor productivity we have nowadays.
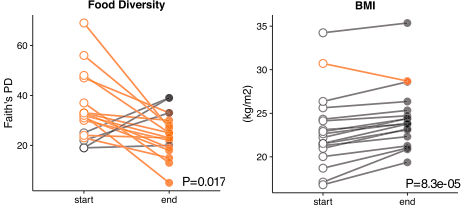
Plot3. The western diet makes up in calories for what it lacks in diversity

This study (US Immigration Westernizes the Human Gut Microbiome) looked at Thai immigrants to the US over tens of years (including first and second gen immigrants) and compared their dietary patterns and some biomarkers to the control of US population. It found out that the immigrant microbiome gradually becomes US-like which also means it loses much of the original bacterial strains that can digest plant fiber. This appears to be a product of dietary changes. The US diet is markedly less diverse than the original Thai one and the immigrants gradually gravitate towards. The western diet is higher in fat and sugar and relatively lower in protein. Not surprisingly this leads to BMI increase, as well as increase of prevalence of obesity among immigrants over the years they reside in the US. The immediate takeaway here is, if you move to the US or live there already, do watch your diet (eating plant-based would help)!
Final remarks
Ok those were three of the many figures I looked at recently that made me stop and think! I hope you have gotten something useful from them as well. All three plots come from papers or resources that are freely accessible so go ahead and dig deeper into the studies if you find them interesting! Thanks for reading everyone 😊
comments powered by Disqus